Explain Data Mining for Financial Data Analysis.
Mining for Financial Data Analysis
Most banks and financial institutions offer a wide variety of banking, investment, and credit services (the latter include business, mortgage, and automobile loans and credit cards). Some also offer insurance and stock investment services. Financial data collected in the banking and financial industry are often relatively complete, reliable, and of high quality, which facilitates systematic data analysis and data mining. Here we present a few typical cases.
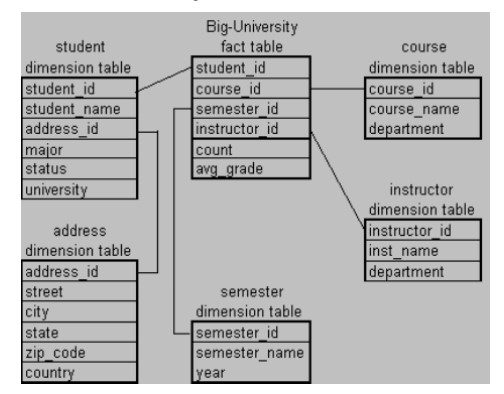
Design and construction of data warehouses for multidimensional data analysis and data mining: Like many other applications, data warehouses need to be constructed for banking and financial data. Multidimensional data analysis methods should be used to analyze the general properties of such data. For example, a company's financial officer may want to view the debt and revenue changes by month, region, and sector, and other factors, along with maximum, minimum, total, average, trend, deviation, and other statistical information. Data warehouses, data cubes (including advanced data cube concepts such as multi-feature, discovery-driven, regression, and prediction data cubes), characterization and class comparisons, clustering, and outlier analysis will all play important roles in financial data analysis and mining.
Loan payment prediction and customer credit policy analysis: Loan payment pre-diction and customer credit analysis are critical to the business of a bank. Many factors can strongly or weakly influence loan payment performance and customer credit rating. Data mining methods, such as attribute selection and attribute relevance ranking, may help identify important factors and eliminate irrelevant ones. 400 alles For example, factors related to the risk of loan payments include loan-to-value ratio, term of the loan, debt ratio (total amount of monthly debt versus total monthly income), payment-to-income ratio, customer income level, education level, residence region, and credit history. Analysis of the customer payment history may find that, say, the payment-to-income ratio is a dominant factor, while education level and the debt ratio are not. The bank may then decide to adjust its loan-granting policy so as to grant loans to those customers whose applications were previously denied but whose profiles show relatively low risks according to the critical factor analysis. Classification and clustering of customers for targeted marketing: Classification and clustering methods can be used for customer group identification and targeted marketing. For example, we can use classification to identify the most crucial factors that may influence a customer's decision regarding banking. Customers with similar behaviors regarding loan payments may be identified by multidimensional clustering techniques. These can help identify customer groups, associate a new customer with an appropriate customer group, and facilitate targeted marketing.
Detection of money laundering and other financial crimes: To detect money laundering and other financial crimes, it is important to integrate information from multiple, heterogeneous databases (e.g., bank transaction databases and federal or state criminal history databases), as long as they are potentially related to the study. Multiple data analysis tools can then be used to detect unusual patterns, such as large amounts of cash flow at certain periods, by certain groups of customers. Useful tools include data visualization tools (to display transaction activities using graphs by time and by groups of customers), linkage and information network analysis tools (to identify links among different customers and activities), classification tools (to filter unrelated attributes and rank the highly related ones), clustering tools (to group different cases), outlier analysis tools (to detect unusual amounts of fund transfers or other activities), and sequential pattern analysis tools (to characterize unusual access sequences). These tools may identify important relationships and patterns of activities and help investigators focus on suspicious cases for further detailed examination.


Comments
Post a Comment