Explain Data Mining for Retail Industry and and Telecommunication Industries.
Data Mining for Retail and Telecommunication Industries
- The retail industry is a well-fit application area for data mining since it collects huge amounts of data on sales, customer shopping history, goods transportation, consumption, and service. The quantity of data collected continues to expand rapidly, especially due to the increasing availability, ease, and popularity of business conducted on the Web, or e-commerce. Today, most major chain stores also have websites where customers can make purchases online. Some businesses, such as Amazon.com (www.amazon.com), exist solely online, without any brick-and-mortar (i.e., physical) store locations. Retail data provide a rich source for data mining.
- Retail data mining can help identify customer buying behaviors, discover customer shopping patterns and trends, improve the quality of customer service, achieve better customer retention and satisfaction, enhance goods consumption ratios, design more effective goods transportation and distribution policies, and reduce the cost of business.
A few examples of data mining in the retail industry are outlined as follows:
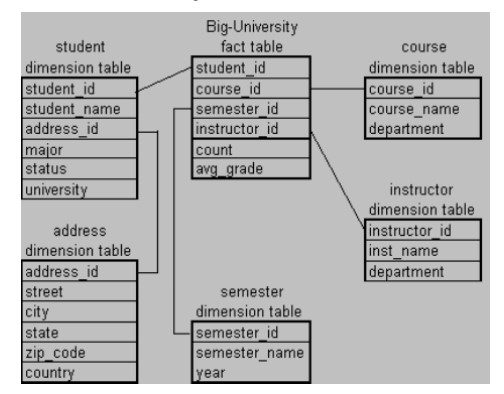
Design and construction of data warehouses: Because retail data cover a wide spectrum (including sales, customers, employees, goods transportation, consumption, and services), there can be many ways to design a data warehouse for this industry. The levels of detail to include can vary substantially. The outcome of preliminary data mining exercises can be used to help guide the design and development of data warehouse structures. This involves deciding which dimensions and levels to include and what preprocessing to perform to facilitate effective data mining.
Multidimensional analysis of sales, customers, products, time, and region: The retail industry requires timely information regarding customer needs, product sales, trends, and fashions, as well as the quality, cost, profit, and service of commodities. It is therefore important to provide powerful multidimensional analysis and visualization tools, including the construction of sophisticated data cubes according to the needs of data analysis. The advanced data cube structures introduced in Chapter 5 are useful in retail data analysis because they facilitate analysis on multidimensional aggregates with complex conditions.
Analysis of the effectiveness of sales campaigns: The retail industry conducts sales campaigns using advertisements, coupons, and various kinds of discounts and bonuses to promote products and attract customers. Careful analysis of the effectiveness of sales campaigns can help improve company profits. Multidimensional analysis can be used for this purpose by comparing the number of sales and the number of transactions containing the sales items during the sales period versus those containing the same items before or after the sales campaign. Moreover, association analysis may disclose which items are likely to be purchased together with the items on sale, especially in comparison with the sales before or after the campaign.
Customer retention analysis of customer loyalty: We can use customer loyalty card information to register sequences of purchases of particular customers. Customer loyalty and purchase trends can be analyzed systematically. Goods purchased at different periods by the same customers can be grouped into sequences. Sequential pattern mining can then be used to investigate changes in customer consumption or loyalty and suggest adjustments on the pricing and variety of goods to help retain customers and attract new ones.
Product recommendation and cross-referencing of items: By mining associations from sales records, we may discover that a customer who buys a digital camera is likely to buy another set of items. Such information can be used to form product recommendations. Collaborative recommender systems (Section 13.3.5) use data mining techniques to make personalized product recommendations during live customer transactions, based on the opinions of other customers. Product recommendations can also be advertised on sales receipts, in weekly flyers, or on the Web to help improve customer service, aid customers in selecting items and increase sales. Similarly, information, such as "hot items this week" or attractive deals, can be displayed together with associative information to promote sales.
Fraudulent analysis and the identification of unusual patterns: Fraudulent activity costs the retail industry millions of dollars per year. It is important to (1) identify potentially fraudulent users and their atypical usage patterns; (2) detect attempts to gain fraudulent entry or unauthorized access to individual and organizational accounts; and (3) discover unusual patterns that may need special attention. Many of these patterns can be discovered by multidimensional analysis, cluster analysis, and outlier analysis.
Data Mining for Telecommunication Industries
- As another industry that handles huge amounts of data, the telecommunication industry has quickly evolved from offering local and long-distance telephone services to providing many other comprehensive communication services. These include cellular phones, smartphones, Internet access, email, text messages, images, computer and web data transmissions, and other data traffic. The integration of telecommunication, computer network, the Internet, and numerous other means of communication and computing has been underway, changing the face of telecommunications and computing. This has created a great demand for data mining to help understand business dynamics, identify telecommunication patterns, catch fraudulent activities, make better use of resources, and improve service quality.
- Data mining tasks in telecommunications share many similarities with those in the retail industry. Common tasks include constructing large-scale data warehouses and performing multidimensional visualization, OLAP, and in-depth analysis of trends, customer patterns, and sequential patterns. Such tasks contribute to business improvements, cost reduction, customer retention, fraud analysis, and sharpening the edges of competition. There are many data mining tasks for which customized data mining tools for telecommunication have been flourishing and are expected to play increasingly important roles in business.
- Data mining has been popularly used in many other industries, such as insurance, manufacturing, and health care, as well as for the analysis of governmental and institutional administration data. Although each industry has its own characteristic data sets and application demands, they share many common principles and methodologies. Therefore, through effective mining in one industry, we may gain experience and methodologies that can be transferred to other industrial applications.
.png)

Comments
Post a Comment