Explain binning method to handle noisy data with example.

Noise is a random error or variance in a measured variable. 

Binning method: Binning methods smooth a sorted data value by consulting its “neighborhood,” i.e. the values around it. The sorted values are distributed into a number of “buckets,” or bins.


Binning Methods for Data Smoothing

Let’s look at the following data smoothing techniques:

Sorted data for price (in dollars): 4, 8, 9, 15, 21, 21, 24, 25, 26, 28, 29, 34

* Partition into (equal frequency) bins:

- Bin 1: 4, 8, 9, 15

- Bin 2: 21, 21, 24, 25

- Bin 3: 26, 28, 29, 34

* Smoothing by bin means:

- Bin 1: 9, 9, 9, 9

- Bin 2: 23, 23, 23, 23

- Bin 3: 29, 29, 29, 29

* Smoothing by bin boundaries:

- Bin 1: 4, 4, 4, 15

- Bin 2: 21, 21, 25, 25

- Bin 3: 26, 26, 26, 34


In smoothing by bin means, each value in a bin is replaced by the mean value of the bin. For example, the mean of the values 4, 8, and 15 in Bin 1 is 9. Therefore, each original value in this bin is replaced by the value 9.

Similarly, smoothing by bin medians can be employed, in which each bin value is replaced by the bin median.

In smoothing by bin boundaries, the minimum and maximum values in a given bin are identified as the bin boundaries. Each bin value is then replaced by the closest boundary value. In general, the larger the width, the greater the effect of the smoothing.


Comments

Popular posts from this blog

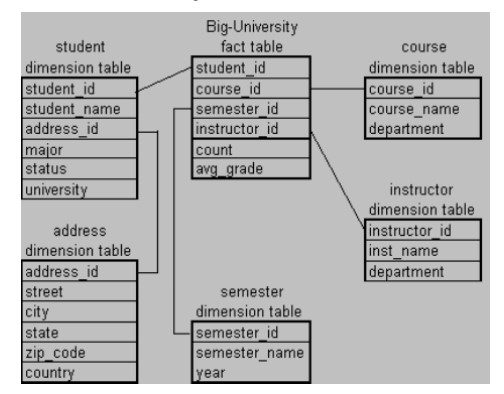
Suppose that a data warehouse for Big-University consists of the following four dimensions: student, course, semester, and instructor, and two measures count and avg_grade. When at the lowest conceptual level (e.g., for a given student, course, semester, and instructor combination), the avg_grade measure stores the actual course grade of the student. At higher conceptual levels, avg_grade stores the average grade for the given combination. a) Draw a snowflake schema diagram for the data warehouse. b) Starting with the base cuboid [student, course, semester, instructor], what specific OLAP operations (e.g., roll-up from semester to year) should one perform in order to list the average grade of CS courses for each BigUniversity student. c) If each dimension has five levels (including all), such as “student < major < status < university < all”, how many cuboids will this cube contain (including the base and apex cuboids)?

Suppose that a data warehouse consists of the four dimensions; date, spectator, location, and game, and the two measures, count and charge, where charge is the fee that a spectator pays when watching a game on a given date. Spectators may be students, adults, or seniors, with each category having its own charge rate. a) Draw a star schema diagram for the data b) Starting with the base cuboid [date; spectator; location; game], what specific OLAP operations should perform in order to list the total charge paid by student spectators at GM Place in 2004?

Suppose that a data warehouse consists of the three dimensions time, doctor, and patient, and the two measures count and charge, where a charge is the fee that a doctor charges a patient for a visit. a) Draw a schema diagram for the above data warehouse using one of the schemas. [star, snowflake, fact constellation] b) Starting with the base cuboid [day, doctor, patient], what specific OLAP operations should be performed in order to list the total fee collected by each doctor in 2004? c) To obtain the same list, write an SQL query assuming the data are stored in a relational database with the schema fee (day, month, year, doctor, hospital, patient, count, charge)