Explain Data Warehouse Architecture.
Data Warehouse Architecture
Data warehouses often adopt a three-tier architecture, as presented in Figure below:
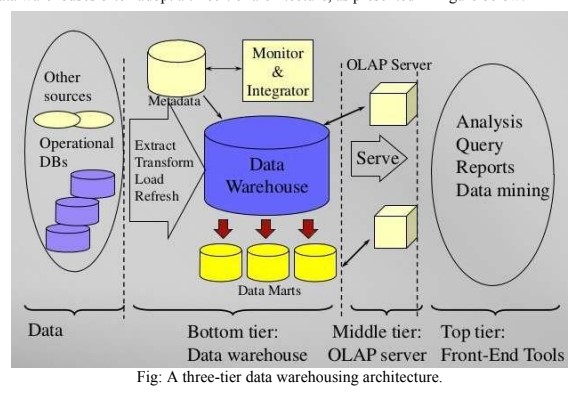
1. Data Sources: A data warehouse system uses heterogeneous sources of data either from operational databases or from some external sources.
2. Bottom Tier: The bottom tier of the architecture is the data warehouse database server. It is the relational database system. Data is fed into the bottom tier by some back-end tools and utilities. The back end tools and utilities perform the following functions:
- Data extraction: gathers data from multiple, heterogeneous and external sources.
- Data cleaning: Detect errors in data and correct them when possible.
- Data transformation: converts data from legacy or host format to warehouse format.
- Load: which sorts, summarizes, checks integrity, and builds indices and partitions.
- Refresh: This involves updating data sources to the warehouse.
3. Middle Tier: Middle tier is an OLAP server that can be implemented using either the relational OLAP (ROLAP) model or the multidimensional OLAP (MOLAP) model.
- ROLAP is an extended relational database management system. The ROLAP maps the operations on multidimensional data to standard relational operations.
- MOLAP directly implements multidimensional data and operations.
4. Top Tier: The top tier is a front-end client layer. The top tier layer holds the following tools:
- Query and Reporting tools: Production reporting tool.
- Analysis tools: Prepare charts based on analysis.
- Data mining tools: Discover hidden knowledge, patterns.


Comments
Post a Comment