Short note on Mining Spatiotemporal Data and Moving Objects.

 Spatiotemporal data are data that relate to both space and time. Spatiotemporal data mining refers to the process of discovering patterns and knowledge from spatiotemporal data. Typical examples of spatiotemporal data mining include discovering the evolutionary history of cities and lands, uncovering weather patterns, predicting earthquakes and hurricanes, and determining global warming trends. Spatiotemporal data mining has become increasingly important and has far-reaching implications, given the popularity of mobile services, and digital Earth, as well as satellite, RFID, sensor, wireless, and video technologies.

Among many kinds of spatiotemporal data, moving-object data (i.e., data about moving to attach equipment on wildlife to analyze ecological behavior, mobility managers embed GPS in cars to better monitor and guide vehicles, and meteorologists use weather satellites and radars to observe hurricanes. Massive-scale moving-object data are becoming sich Javary rich, complex, and ubiquitous. Examples of moving-object data mining include mining org laminate movement patterns of multiple moving objects (i.e., the discovery of relationships among s multiple moving objects such as moving clusters, leaders and followers, merge, convey, swarm, and pincer, as well as other collective movement patterns).

Comments

Popular posts from this blog

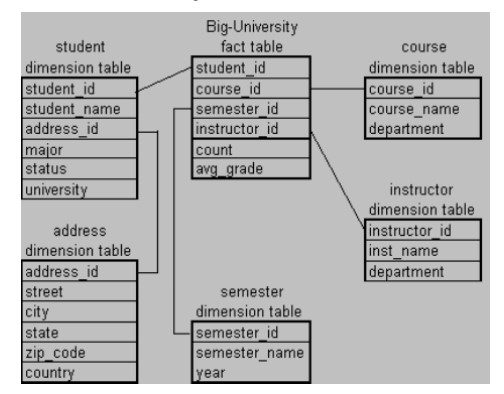
Suppose that a data warehouse for Big-University consists of the following four dimensions: student, course, semester, and instructor, and two measures count and avg_grade. When at the lowest conceptual level (e.g., for a given student, course, semester, and instructor combination), the avg_grade measure stores the actual course grade of the student. At higher conceptual levels, avg_grade stores the average grade for the given combination. a) Draw a snowflake schema diagram for the data warehouse. b) Starting with the base cuboid [student, course, semester, instructor], what specific OLAP operations (e.g., roll-up from semester to year) should one perform in order to list the average grade of CS courses for each BigUniversity student. c) If each dimension has five levels (including all), such as “student < major < status < university < all”, how many cuboids will this cube contain (including the base and apex cuboids)?

Suppose that a data warehouse consists of the four dimensions; date, spectator, location, and game, and the two measures, count and charge, where charge is the fee that a spectator pays when watching a game on a given date. Spectators may be students, adults, or seniors, with each category having its own charge rate. a) Draw a star schema diagram for the data b) Starting with the base cuboid [date; spectator; location; game], what specific OLAP operations should perform in order to list the total charge paid by student spectators at GM Place in 2004?

Explain network topology .Explain tis types with its advantages and disadvantges.