Explain Data Transformation by Normalization and explain many methods for data normalization.

 Normalizing the data attempts to give all attributes an equal weight. Normalization is particularly useful for classification algorithms involving neural networks or distance measurements such as nearest-neighbor classification and clustering. If using the neural network backpropagation algorithm for classification mining (Chapter 9), normalizing the input values for each attribute measured in the training tuples will help speed up the learning phase. For distance-based methods, normalization helps prevent attributes with initially large ranges (e.g., income) from outweighing attributes with initially smaller ranges (e.g., binary attributes). It is also useful when given knowledge of the data. 

There are many methods for data normalization. We study min-max normalization, z-score normalization, and normalization by decimal scaling. For our discussion, let A be a numeric attribute with n observed values, V₁, V2,..., Vn.

a)min-max normalization


b)z-score normalization


c)normalization by decimal scaling

Comments

Popular posts from this blog

Discuss classification or taxonomy of virtualization at different levels.

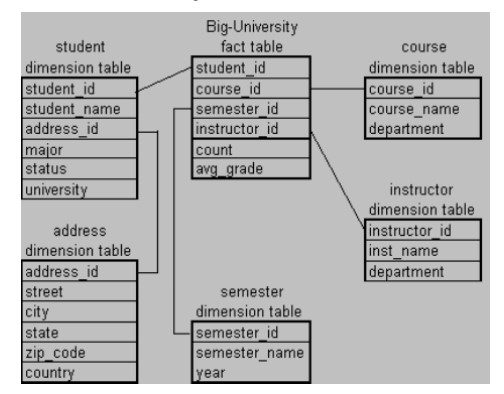
Suppose that a data warehouse for Big-University consists of the following four dimensions: student, course, semester, and instructor, and two measures count and avg_grade. When at the lowest conceptual level (e.g., for a given student, course, semester, and instructor combination), the avg_grade measure stores the actual course grade of the student. At higher conceptual levels, avg_grade stores the average grade for the given combination. a) Draw a snowflake schema diagram for the data warehouse. b) Starting with the base cuboid [student, course, semester, instructor], what specific OLAP operations (e.g., roll-up from semester to year) should one perform in order to list the average grade of CS courses for each BigUniversity student. c) If each dimension has five levels (including all), such as “student < major < status < university < all”, how many cuboids will this cube contain (including the base and apex cuboids)?

Suppose that a data warehouse consists of the three dimensions time, doctor, and patient, and the two measures count and charge, where a charge is the fee that a doctor charges a patient for a visit. a) Draw a schema diagram for the above data warehouse using one of the schemas. [star, snowflake, fact constellation] b) Starting with the base cuboid [day, doctor, patient], what specific OLAP operations should be performed in order to list the total fee collected by each doctor in 2004? c) To obtain the same list, write an SQL query assuming the data are stored in a relational database with the schema fee (day, month, year, doctor, hospital, patient, count, charge)